This is a demonstration, not a client engagement. The data below is synthetic — generated by a script, not pulled from a real organization. Every number in this write-up is the actual output of that simulation (nothing was hand-picked or smoothed to look better), so the walkthrough is honest about what a promotion-readiness model can and can't do — including where it comes up short.
The question
A mid-size organization wants to identify, twice a year, which of its mid-level employees are ready for promotion in the next 12–18 months. Today that decision leans heavily on two inputs: how long someone has been in their current role, and their last annual performance rating. Both are easy to pull from the HRIS. Neither was designed to predict readiness.
Are tenure and performance rating actually telling you what you think they're telling you? That's the question this analysis is built to answer.
Why the easy proxies fall short
Before building anything new, it's worth scoring the status quo. A logistic regression using only tenure and last performance rating, tested against 18-month promotion outcomes on a held-out sample, discriminates barely better than chance.
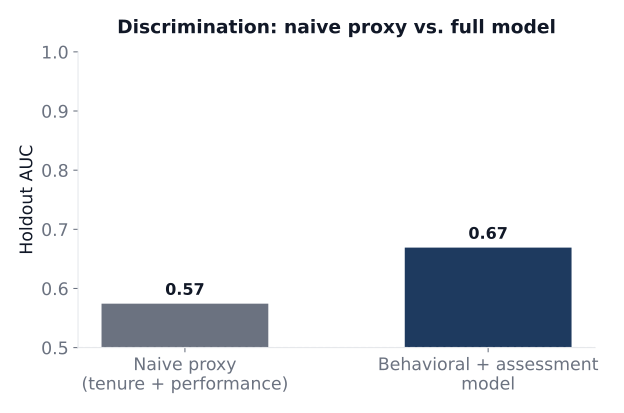
An AUC of 0.57 is close to noise. Tenure and performance rating aren't measuring readiness — they're measuring how long someone has sat in a seat and how their manager felt about last year. Useful information, but not the construct that actually matters here.
Designing the measure
Following the same logic as any measurement problem: before building a predictive model, define what "promotion readiness" actually means, then build instruments that measure it.
Two new inputs were added:
- A structured behavioral observation rubric. Managers rate two dimensions — leadership behaviors (ownership under ambiguity, developing others, influence without authority) and execution behaviors (delivery, follow-through) — on a defined 1–5 scale, anchored to specific observable behaviors rather than general impressions.
- Validated assessment data. A situational-judgment assessment (reported as a standardized score) and a structured competency-panel composite (0–100), both designed to measure job-relevant judgment and competency rather than tenure or likeability.
Neither instrument is assumed to be a perfect measure of readiness. Behavioral ratings and assessment scores are treated as what they are: noisy, imperfectly reliable indicators of an underlying trait — not the trait itself.
The model
A logistic regression predicts the probability of promotion within 18 months from all four new inputs, controlling for tenure and performance rating. On the same holdout sample, discrimination improves from 0.57 to 0.67 — a real, if modest, gain. Modest is the honest word: this is 450 employees, not 45,000, and the model says so.
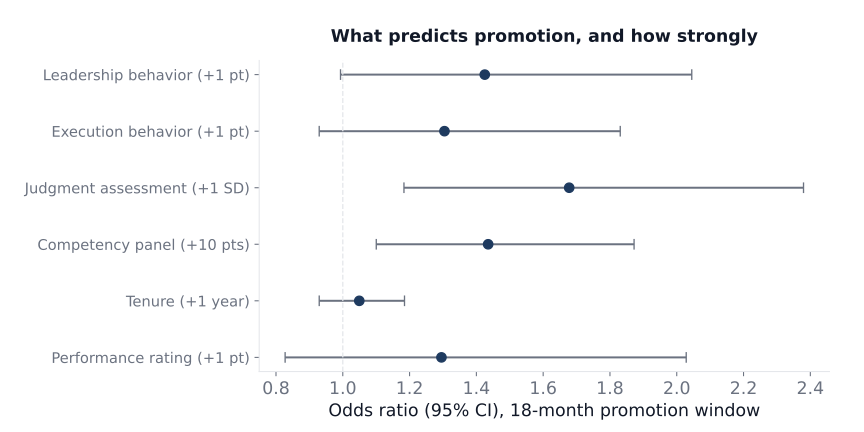
Two predictors clear conventional statistical significance on their own: the judgment assessment (OR 1.68, 95% CI 1.18–2.38) and the competency panel score (OR 1.04 per point, compounding to roughly 1.4x per 10 points). The behavioral ratings point the expected direction but their confidence intervals still touch 1.0 — a plausible real effect that this sample isn't quite large enough to pin down precisely. Tenure, once the assessment and behavioral data are in the model, adds almost nothing. That's the headline: the "easy" data was the weakest data.
This is exactly the kind of result a black-box model would hide. A coefficient table with confidence intervals tells you not just what the model predicts, but how much to trust each piece of it — which is the difference between a model you can act on and one you're just hoping works.
Is the confidence real?
A model can discriminate well and still lie about its own certainty. Calibration checks whether "40% likely to be promoted" actually means promoted about 40% of the time.
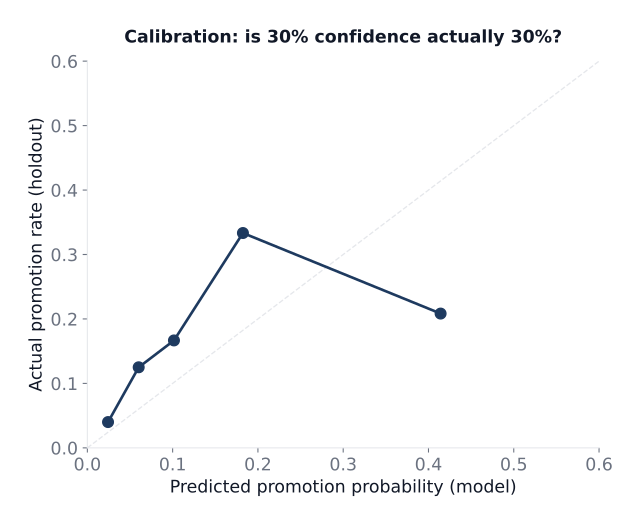
Calibration holds up well through the middle of the distribution, then wobbles in the highest-confidence bin — predicted ~41%, actual ~21%. That's not a model failure to paper over; it's what happens when a bin has 24 people in it. Small cells produce noisy estimates, and the honest response is to say so, not to smooth the line and call it precision. With more data, that top bin would need re-checking before anyone treats it as reliable.
From score to decision
The practical output isn't a probability to three decimal places — it's a tier a manager can act on. Splitting the holdout population into three readiness bands shows real separation:
Employees in the "Ready Now" tier were promoted at over three times the rate of the "Not Yet" tier. That's a usable signal for prioritizing development conversations and succession planning — not a verdict to hand down automatically, but a starting point for a better-informed one.
What this demonstrates — and its limits
With synthetic data standing in for a real organization, the numbers above shouldn't be quoted as general truths about promotion prediction. What the exercise does demonstrate is the method: define the construct, build instruments that measure it with known reliability, test the result against a naive baseline, check calibration honestly, and report uncertainty rather than hide it.
A real engagement would go further than this demo does — testing for adverse impact across demographic groups before any score touches a real decision, estimating measurement reliability for the behavioral rubric directly, and validating the model on a genuinely future holdout rather than a random split of existing data. None of that is optional in practice; all of it is out of scope for an illustrative write-up.
Want to see this built on your data? The approach — measurement design first, prediction second, honest about uncertainty throughout — is the same one used in real engagements. Start a conversation or read more about workforce prediction models.